

Which format to keep?
Compare what your posts, carousels and videos bring in.
Analytics
Every day, Perroly takes a snapshot of your accounts. You see trends rather than accidents, and you follow your competitors to keep the context.
 Instagram
 Facebook
 YouTube
The dashboard
For every connected Instagram account, Facebook Page and YouTube channel: your audience, your reach, your engagement and how your posts perform, as readable curves rather than endless tables.
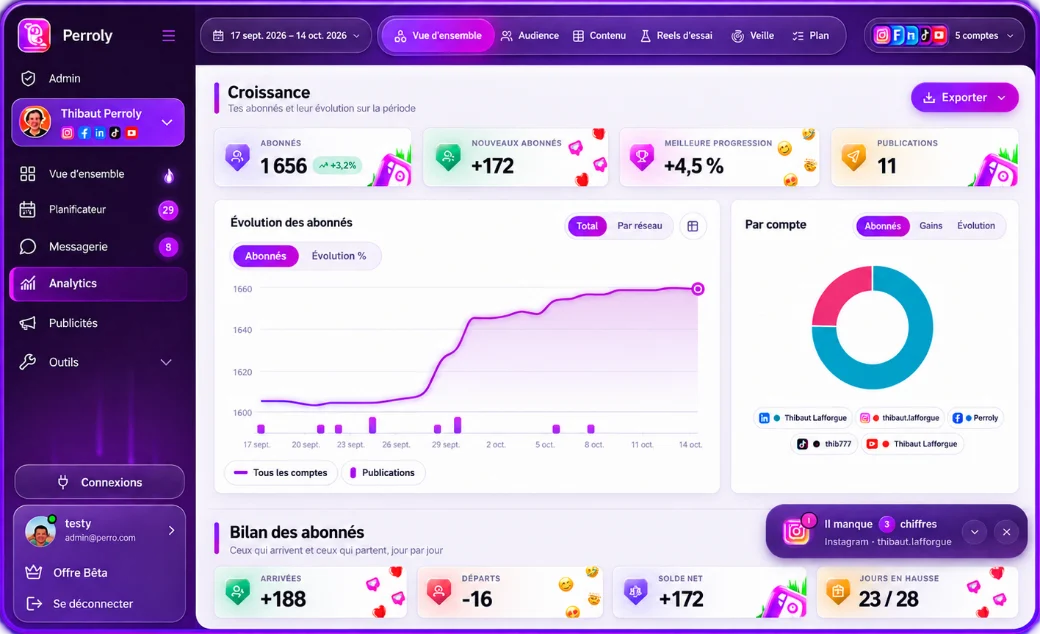
Analytics cover Instagram, Facebook and YouTube, and competitor tracking covers Instagram. LinkedIn, TikTok and Threads don’t have analytics in Perroly yet. See the feature table
Perroly records a snapshot of your accounts every day. The curves build up week after week, and real trends stand out from one-day swings.
Competitor tracking
Add Instagram accounts to follow: Perroly collects their public numbers every day and draws the same curves as for your own accounts. You see their posting pace, their growth and what works for them, and you put your own results in the context of your sector.
The goal isn’t to pile up metrics, it’s to answer concrete questions.
Compare what your posts, carousels and videos bring in.
Spot the moments when your posts work best.
Put your curves next to your competitors’.
Go further
One editor, a calendar and scheduling on six networks.
Learn moreThe shared Instagram and Facebook inbox, the triggers and the scenario editor.
Learn moreCreate, boost and track your campaigns on Meta, Google, TikTok, LinkedIn, Pinterest, Snapchat and ChatGPT Ads.
Learn moreInstagram, Facebook, LinkedIn, TikTok, YouTube, Threads and your ads, in one app.
Create my account